Freundlich isotherms
Assuming that quasi-equilibrium is achieved in a slurry experiment, the most commonly observed deviation from equation 1 is a gradual decrease in Kd with increasing apparent chemical equilibrium concentration, giving a non-linear isotherm with a negative curvature. This is usually fitted to a straight line via least-squares regression using a log-log transformation of the data; the result is referred to as the Freundlich isotherm.
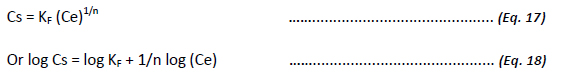
Where KF is Freundlich's constant, and 1/n is the exponent of non-linearity (explained below)
Non-linearity is observed, especially with chemicals which are not extremely hydrophobic and therefore not limited by solubility to extremely low concentrations. However, any sorption isotherm which covers a wide concentration range (say, more than two orders of magnitude), even if the whole range is at very low concentrations, will typically be non-linear, presumably because a range of sorption processes taking place.
The most important consequence of isotherm non-linearity of the Freundlich type with 1/n < 1 is that the mobility of chemicals at very high concentrations will be under-predicted by Kd or KOC values measured at lower concentrations.
The interpretation of 1/n values and the usefulness of Freundlich regression
The 1/n value derived from the Freundlich equation serves to describe the linearity of adsorption or alternatively the degree of curvature of the isotherms described above across the concentration range tested.
Typically, 1/n values range from 1 downwards. A value of 1 signifies that the relative adsorption (adsorption partition) of the chemical was the same across the whole range tested (C-type isotherm), which is unusual (especially across the concentration range of two orders of magnitude often used in regulatory studies), but not unheard of.
More normally, 1/n values will range from 0.7 to 1.0. These values show that when the concentration of chemical under investigation increases, the relative adsorption decreases (L-type isotherm). This tends to be indicative of saturation of adsorption sites available to the chemical, resulting in relatively less adsorption. 1/n values of less than 0.7 describe highly curved isotherms. A simple visual representation of the typical isotherms (for 1/n . 1) is shown below (Figure 6).
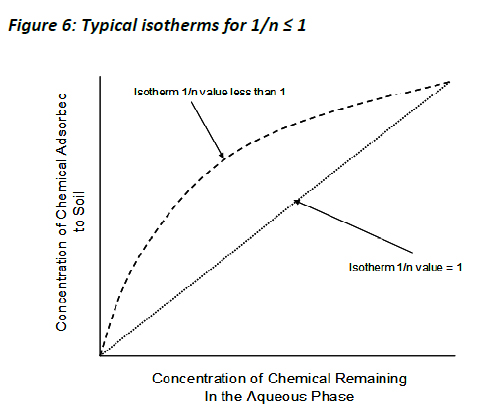
1/n values of > 1 are indicative of S-type isotherms. These are relatively uncommon but are often observed at low concentration ranges for compounds containing a polar functional group. It has been hypothesised that, at low concentrations, such compounds are in competition with water for adsorption sites.
Care should be taken when extrapolating to obtain KF values that are not within the concentration range tested. There is some evidence that especially at very low concentrations the proportion sorbed to the solid phase can increase significantly.
The reproducibility of the data used to generate the Freundlich adsorption coefficient can be judged to some degree by means of the coefficient of determination r2. The closer to 1 the value is then the more reproducible the data used to calculate. Wherever possible, r2 values should be greater than 0.9, showing a good degree of reproducibility, in turn giving confidence in the data. However, at either extremely small or high adsorption values, e.g. KF values of greater than 50 or less than 0.5, the intrinsic variability of the experimental data will more often than not dictate that r2 values less than this must be expected. For an indication of data reliability, the reader is advised to always look at the linear adsorption isotherm visually, rather than just use the r2 value.