Technical Report 120
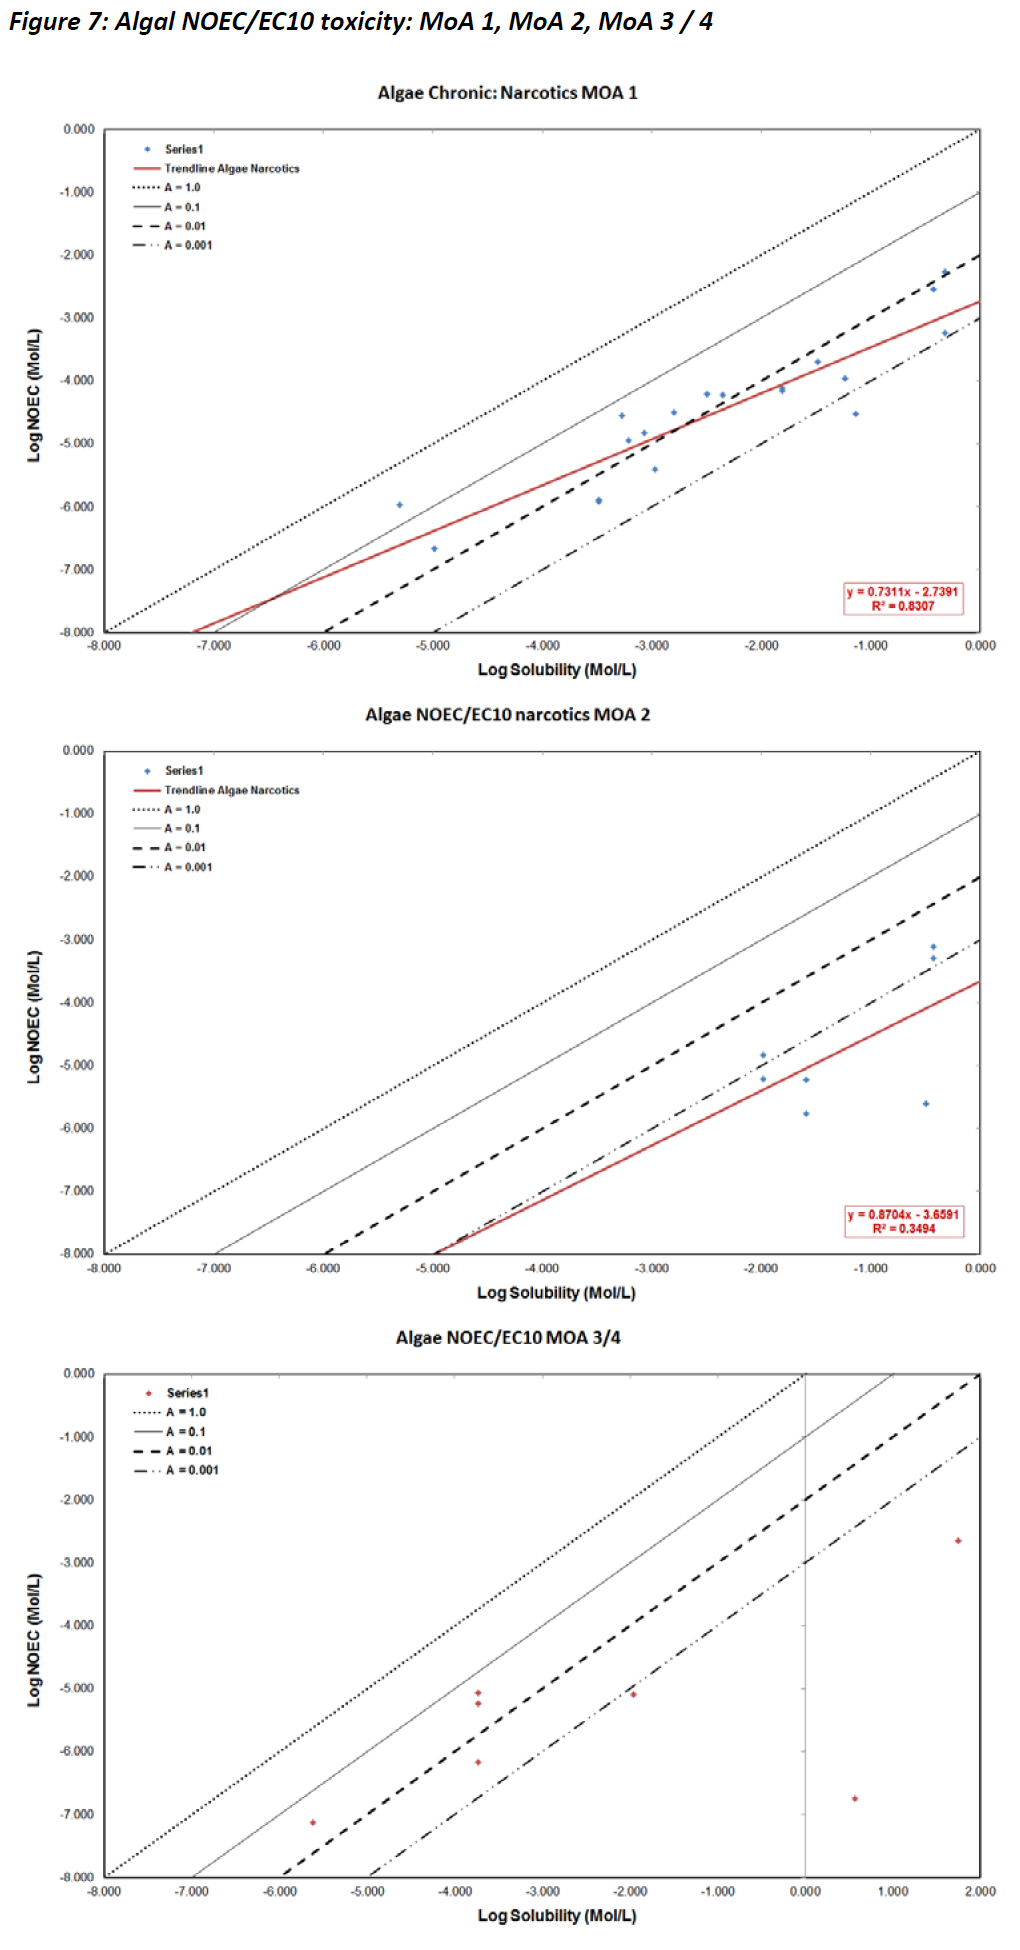
Algal NOEC/EC10 toxicity data
Algal NOEC/EC10 data are presented in Figure 7. Slopes for the algal EC50 and NOEC/EC10 MoA 1 plots are similar, probably because the NOECs were derived from the same studies as the EC50s presented in Section 3.3. Minimal availability of high quality data and a limited range of solubilities, make interpretation of non-MoA 1 algal plots difficult.