DISCUSSIONS AND CONCLUSIONS
There are few previous studies addressing the potential use of activity as an indicator of toxicity which are directly applicable to standard regulatory ecological risk assessment, but the number is increasing (Reichenberg and Mayer, 2006; Smith et al, 2010). The work carried out by the aforementioned authors and others (Ferguson, 1939; Mackay et al, 2009) has therefore clarified and demonstrated the value of this approach but there still exists a paucity of quality data available for both physico-chemical properties and ecotoxicity. Moreover, generally the narcotic modes of action have been taken together in the dataset while the activities of MoA 2 appear to be slightly higher than those of MoA 1. The impact of pH on ionising chemicals and relative toxicity of the ionised and unionised forms may be a confounding factor when included in the same dataset. In this work, standard regulatory guideline studies on fish, invertebrates and algae have been used and the resulting activities compared for four MoAs separately. The major emphasis has been placed on the MoA 1 chemicals for which data were more readily available and verifiable (increasing confidence in their validity). Less emphasis has been placed on MoA 2 substances for which fewer data were available and due to their ionising potential, over a shorter solubility range with higher variability in results than MoA 1 chemicals.
The objectives of this study were to examine possible relationships between activity as sub-cooled liquid solubility and aquatic toxicity using an evaluated experimental dataset. In principle the aquatic toxicity data should fit within the same regression equation for all species for MoA 1 and 2 substances assuming that equilibrium has been reached (Mackay et al, 2009). This was tested by separating the data into the three trophic levels: fish, invertebrates and algae; and then comparing these relationships separately for MoAs 1 and 2 in order to maximise the precision.
Furthermore, as mentioned earlier, most studies have focussed upon the acute toxicity but the activity for chronic toxicity remained to be elucidated. In this study, considerable effort was made to validate the dataset by using, for the most part, values classified in the available databases as Klimisch 1 and 2 (Klimisch et al, 1997). These data were then further scrutinised. The data used in this exercise are considered fit for purpose although in a few cases significant differences between endpoint values exist for the same substance.
An example of this is 1,4-dichlorobenzene for which only 7 studies out of 15 on fish were judged valid by this ECETOC task force and the results nevertheless varied by a factor of 10 (from 1.12 mg L-1 for a study on O. mykiss to 11.7 mg L-1 for P. promelas). Correcting for temperature used in the studies in this case does not improve the result. Fortunately, such wide variability within trophic level data was the exception rather than the rule. The physico-chemical parameters, both (sub-cooled) solubility and melting point were also subject to variation. They are not used as a regulatory threshold for classification and labelling or risk assessment under current practice of EU risk assessment and so may tend to be seen as ‘dossier fillers’ such that the attention to quality may be less than required for accurate activity determination. It was therefore difficult for the authors to determine whether the data used here were accurate or an approximation. Despite these drawbacks, the data quality in this publication are considered to be generally acceptable, allowing an in depth assessment. Nevertheless, the development of high quality toxicity data as a training or validation set for activity calculations is the only way to achieve certainty in predictions based on activities.
Quantitative studies on activity evaluating a wide variety of chemical structures are rare, and limited to recent studies due to the reanimation of the topic in ecotoxicology and risk assessment (Mayer and Holmstrup, 2008; Mackay et al, 2009; Smith et al, 2010; Engraff et al, 2011). The intent of the present study was to evaluate whether the principle of activity holds true for a high quality dataset. The extent to which current guideline-based studies, which have not been performed with this aim in mind and therefore, may contain experimental deficiencies, can still be used to provide accurate toxicity data which fit with the activity concept have also been considered here.
In practice, this has meant that approximately two thirds of the current data are not fit for purpose (all the studies in the ECHA disseminated dataset which did not meet Klimisch 1 or 2 and 30% of the data which apparently attained the score but were still found to have methodological difficulties for the purpose of this study). Nevertheless, the remaining data were of sufficient quality for use where and, while there is still variability in the results of standard studies, it seems that well executed aquatic toxicity tests in most cases (at solubilities that are > 0.1 mmol L-1) fit well with the concept of activity for MoA 1.
The imperfect fits to the regression lines could be due to several sources: lack of high quality solubility, melting point and/or ecotoxicity, lack of sufficient experimental duration to achieve equilibrium and to some extent for chronic data, the use of NOECs rather than a more appropriate statistical method to calculate the value. For very low solubility substances (< 0.1 mmol L-1) analytical and dosing methods become less accurate due to adsorption of the test substance (to equipment, food and faeces) and due to inappropriate methodology that fails to account for the truly dissolved fraction of the chemical. Alternatively, constant dosing methods employing solid phase technology that currently are being used more frequently (Smith et al, 2010) together with chromatography techniques have made significant improvements in terms of sample analysis turn-around time and limit of quantitation over the last decade. It is therefore possible that appropriate analytical methodologies that are now available will provide the definitive database from which an appropriate QSAR could be developed and both acute and chronic ecotoxicity could be predicted, at least for MoA 1 chemicals and potentially also for MoA 2. The potential for experimental reduction in risk assessment is significant if the substance under evaluation can be accurately determined as having only baseline toxicity (or in the case of polar chemicals, slightly higher toxicity). In such cases the number of experimental studies could be limited to a screening evaluation.
• Accounting for MoAs
In order to plot activities accurately, it was essential to determine the modes of action of the substance in the dataset. Data were attributed a score according to the Verhaar and modified Verhaar method (Verhaar et al, 1992; 2000; Enoch et al, 2008), using the online ToxTree software (Patlewicz et al, 2008). Both the original and modified methods were used to verify the data. Some differences in the two methods were noted. For example, the original Verhaar method classification for certain compounds indicates a non-polar narcosis mode of action while the modified Verhaar classification assigns them to a specific mode of action, which was not justified by the activity of these substances as they fell within the expected limits of activity for classification as MoA 1.
In certain cases, results in the present study were found to be in conflict with existing publications. For example, Su et al (2012) found slightly higher toxicity than baseline for nitrobenzene to Tetrahymena pyriformis which they considered equated to MoA 2 toxicity. Here, no such toxicity was noted for fish, invertebrates or algae for this compound, thus it was classified as MoA 1. Despite the expected polarity of this substance the appearance of certain structures can be misleading. The solubility of nitrobenzene (1,900 g m-3) is comparable to that of other singly substituted benzene rings such as chlorobenzene (502 g m-3) and toluene (526 g m-3) despite nitrobenzene possessing a greater dipole (4.22 D) than chlorobenzene (1.69 D) and a much greater dipole moment than toluene (0.36 D). In comparison, aniline has a solubility of 35,000 g m-3 and phenol a value of 70,000 g m-3, while the dipole moments (1.53 D and 1.45 D respectively) are lower than that of nitrobenzene (Nelson et al, 1967). However, the hydrogen bonding ability of both aniline and phenol is significantly greater than that of nitrobenzene, due to the strong H-bond donating and accepting nature of phenol and aniline. Nitrobenzene is a weak H-bond acceptor only and the solubility is thereby reduced. Thus the substance was reclassified as a non-polar narcotic in line with the toxicity (activity) exhibited.
Some substances were classified by observation of their similarity with other compounds (e.g. 2-nitrotoluene and 4-nitrotoluene reclassified as MoA 1 as read-across from 3-nitrotoluene on the basis of the above justification) and provided much better fits in the new MoA classes. Certain other substances such as hexachlorobutadiene also do not seem to fit with the MoA 3 prediction (modified Verhaar) and both acute and chronic data on this substance are consistent with MoA 1 classification. This is also the case for hexachlorobenzene (classified as MoA 4 under modified Verhaar but reclassified as MoA 1 in this exercise as was recommended by the original Verhaar method).
Nevertheless, it should be noted that MoA allocation is still not an exact science and certain data presented here may be re-classified under a new scheme.
• Equilibrium, steady state and variability within the dataset
Excluding external influences (such as addition of food to the test vessels during a chronic study), we would predict that regression slopes and intercepts are the same for fish, invertebrates and algae and if equilibrium / steady state has been reached in all cases there should be no difference between slopes of acute and chronic plots.
According to Mackay et al (2009) the ratio between activity and liquid solubility is in the range of 0.01 to 0.1 for more soluble chemicals increasing from 0.1 to 1 for more hydrophobic substances. Thus, the slope is not 1 as predicted by a constant activity hypothesis but closer to 0.8. This suggests that more hydrophobic substances appear to require higher activities and so are less toxic than predicted. Several explanations are provided by the authors to account for this difference: metabolic biotransformation rates reducing body burdens, reduced bioavailability with increasing hydrophobicity, co-solvents introducing confounding factors, inherent sensitivity of different species, increased activity coefficient of large hydrophobic molecules in the lipid phase or the fact that the tests may not reach equilibrium within the allotted study duration.
To explore these options in more depth, comparisons can be made between slopes of higher and lower solubility compounds and also between slopes for acute and chronic data. For MoA 1 substances, regression lines of acute graphs tend to a slope between 0.6 and 0.75 and those of chronic data between 0.7 and 0.90. Thus activity (read as slope) is closer to the predicted constant activity hypothesis slope value of 1 for chronic than for acute studies. This could be due to a greater chance for equilibrium to be reached during chronic exposures.
To determine whether the slopes of the graphs may be reduced by failure to reach equilibrium within the test duration for low solubility substances, it was necessary to first obtain an approximate value for the equilibrium time at various log KOW values using the method proposed in OECD 305 (OECD, 2012). These could then be related to the solubility data. In the case of the fish MoA 1 plot, three fish studies are not expected to have reached equilibrium as their log KOW was > 4 (SL < 10-4). When the three SL values less than 10-4 are removed the slope for fish effectively increases from 0.73 to 0.77.
The chronic fish regression slope is slightly higher than that found by Mackay et al with a value of 0.87, close to the predicted constant activity hypothesis slope of 1. Nevertheless, the data were verified that the equilibrium time was not exceeded as several of the chronic studies had durations of 28 days or less (see O. latipes, where the endpoint, development, was measured at 17 days). Using Equation 2, for a log KOW value for fish of 6.0 the 95% equilibrium time was 31 days. This value corresponds to a log solubility of approximately -6.3 for our data (see Figure 1) and all but one of the endpoint values were well below this figure. The log KOW of the shorter (less than 28 day) studies did not exceed 5.4. The lowest solubility value (for benzo(k)fluoranthene at 0.0008 mg L-1) was a 42 day growth study on D. rerio and as the value was slightly lower than the regression line, it would seem that equilibrium had also been reached within the duration of this study. Overall, it would seem that the fish had reached equilibrium within the timeframe of the chronic studies.
Time to equilibrium for Daphnia neonates was estimated using a modified calculation from Parkerton et al (2008) (Equation 5), a literature daphnia respiration rate and neonate weight (Chopelet et al, 2008), literature Daphnia growth rate constant for neonates (from days 1-9) (Guan and Wang, 2006). The denominator of equation 5 in Parkerton et al (2008) contains a term for fecal egestion. This term was omitted in our calculations below, as the impact of fecal egestion on Daphnia neonates is expected to be minimal given the small mass of the organisms.
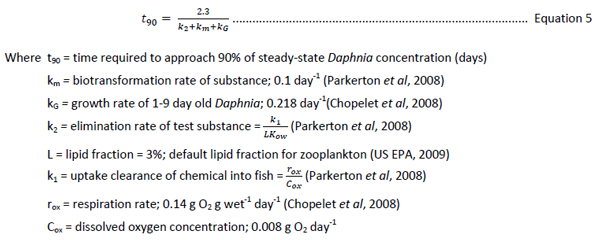
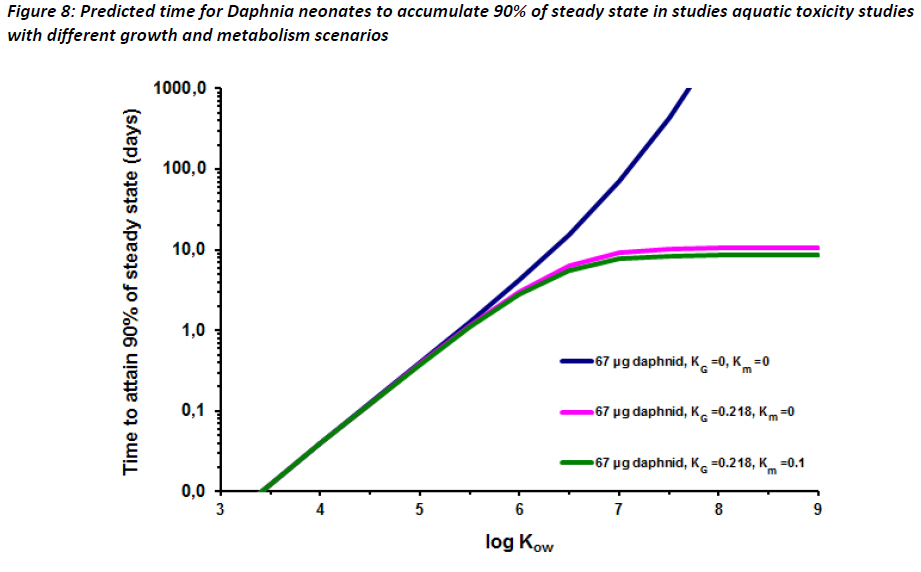
Equation 5 was used to create three plots using values for kG and km (Figure 8). The plots in Figure 8 show that for high log KOW substances, daphnid growth rates allow for 90% of steady state to be reached in approximately seven days assuming km = 0.1. Note that this km is likely to overestimate that in Daphnia. However, as seen in Figure 8, growth rate is the major influence on t90. If km is set to zero, t90 reaches a plateau at approximately 10 days, well inside the duration of OECD 211 (OECD, 2008). These data indicate that it is likely that equilibrium is reached for substances, including highly hydrophobic substances, within ten days assuming that constant concentrations of substance are met.
In this study for acute test data on invertebrates the slope increases from 0.59 to 0.73 if SL values lower than 10-5 mol/L are removed. One hypothesis for this is that it is difficult to maintain constant, accurate concentrations for poorly soluble substances, and that incorrect analytical measurements cause a deviation from the expected slope.
As the toxicity data for algae are based on assays on unicellular organisms, we would expect steady state to be reached over the 72 to 96 hours study period. The slope for algae was also 0.73 which supports this hypothesis.
For multicellular species in the acute dataset it is reasonable to assume that time to equilibrium is not always attained for substances with SL lower than 10-5 mol L-1.
As slopes of chronic data versus solubility tended to be higher than those of acute data, equilibrium may indeed be one of the factors influencing differences between the slopes for experimental and predicted data. Bioavailability was also considered by these authors to be a major influencing factor as the adsorption of low solubility substances to suspended solids may be inadvertently included in samples in many cases. While some of the other factors may also play a role in accounting for the remaining fraction of the slope, most of the other proposals made by Mackay et al (2009) would be most likely to account for data variability across the dataset rather than a systematic increase with hydrophobicity although it is recognised that co-solvents are more likely to be used for low solubility substances.
For chronic invertebrate studies, the slope is mostly based on 21 day daphnid reproduction studies, although some Ceriodaphnia 7 day data has been included and this test system may be less likely to achieve equilibration than the longer reproduction test for substances with a solubility less than 10-5 mol L-1. The chronic test slope (MoA 1) is 0.82 with all data and this decreases slightly to 0.78 if substances at solubility < 10-5.5 mol L-1 are removed. Significant scatter was observed in data below this point suggesting that technical difficulties became increasingly serious at this low solubility level and the validity of the studies is questionable. Separating Ceriodaphnia data from all other chronic data leads to slopes of 0.7 for the longer term (non-Ceriodaphnia) data and approximately 1 for the Ceriodaphnia data. It would therefore appear that there are systematic methodological differences between these two study designs. In this case the longer term data has almost the same slope as the rectified acute invertebrate regression line (with solubility < 10-5 mol L-1 removed) (Figure 9).
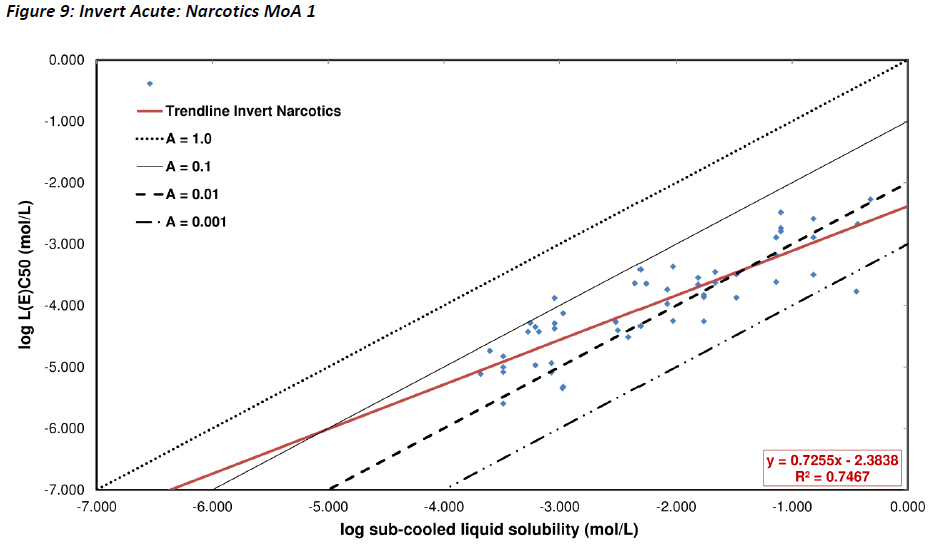
If the invertebrate acute non-polar narcotic data are separated by their degree of solubility, then large differences in slope can be observed. Figure 9 shows the acute invertebrate data with data points for substances with solubility lower than 10-4.4 mol L-1 removed. This changes the slope to 0.73 from 0.59. The new slope is similar to that observed for the chronic invertebrate data at 0.7 and is also closer to the acute fish and algae slopes. This indicates that at lower solubilities (< 10-4.4 mol L-1), factors such as time to reach steady state are playing an increasingly significant role.
For algae, variability within the dataset is slightly greater and validity of the studies more difficult to conclude upon (due to the static design of the test). It is nonetheless reassuring that the slopes for EC50 and NOEC data for MoA 1 chemicals are similar as the time to equilibrium will not change for these endpoints and the slopes for both endpoints at 0.73, were not far from the values found for fish and invertebrates.
• Similarities between intercepts
Intercepts for all studies were analysed and means of intercepts were found to be 2.2 (RSD 6.1% with SL < 10-4.4 mol L-1 removed) for acute fish and daphnid data and algal EC50 studies, and 2.79 (RSD 5.9% including all data) for chronic fish and daphnid data, and algal NOECs/EC10s. Differences of approximately half a log unit between acute and chronic studies were observed at the intercept.
For fish, due to the slight difference between acute and chronic slopes, the graphs diverge slightly with decreasing solubility. For algae and daphnids the difference between EC50 and NOECs remains more or less parallel until the activity of acute studies becomes attenuated, perhaps due to equilibrium not being attained.
A second intercept is the point at which SL will be so low that it will cross the activity line at 1. As it is not possible to have an activity >1 this is the point at which equilibrium can never be reached regardless of the conditions of the study or the lifetime of the organism and the substance can be predicted as non-toxic regardless of the study duration (as an individual substance). Mayer and Reichenberg (2006) reported a melting point cut-off in toxicity, and the point at which the activity of 1 is exceeded occurs when SL is between 10-8 and 10-9 mol L-1 can be described as the solubility cut-off.
• Differences between MoA
This study has concentrated on narcosis and particularly non-polar narcosis. Nevertheless data for MoAs 2, 3 and 4 were included when available (Figure 2-7).
In order to further assess the ability for the activity concept to discriminate between baseline narcosis and specific modes of action, aquatic toxicity data were accessed from the publications by Verhaar et al (1992) and Russom et al (1997). Melting points and water solubilities for these substances were obtained from EPISuite v4.1 (measured values, where available, or estimated values were used) and converted to sub-cooled liquid solubilities using fugacity ratios (in the case of solids at room temperature) as described previously. These were then plotted against fish aquatic toxicity data. Substances that were not predicted to reach 80% of equilibrium within four days were removed from the datasets.
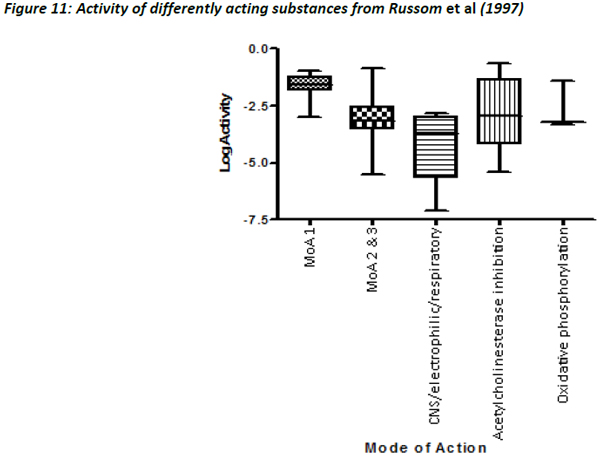
Figures 10 and 11 are different plots of the same data from Russom et al (1997) as the correlation between water solubility and toxicity, as well as the variability and range of activity values associated with the different toxicity classes.
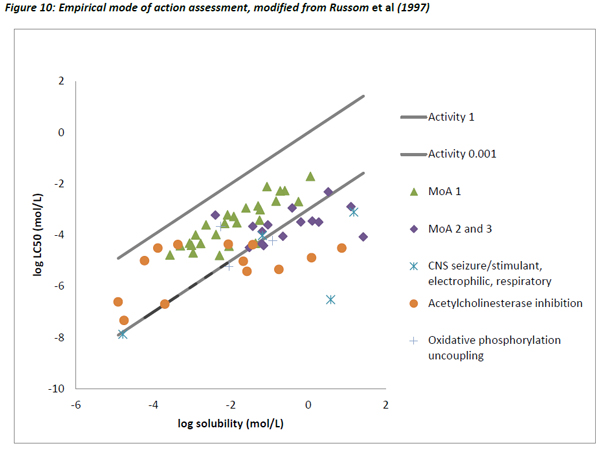
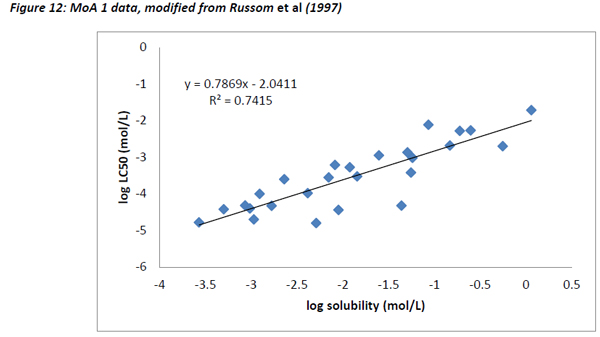
The chemicals that exhibit baseline narcosis behave as expected, with all data points lying above the 0.001 activity line. These substances also show the smallest variability in the range of activities. In addition, there was a reasonably good correlation between the water solubility and LC50 data, suggesting that the changes in toxicity were largely explained by changes in water solubility (Figure 12). In addition, the slope of the regression (0.79) was similar to the one observed by Mackay et al (2009) and also to that for acute fish observed in this work (0.77).
The other MoA substances generally lie close to or below the 0.001 activity line, but there are exceptions to this, most noticeably some chemicals that are classed as Narcosis II and III (MoA 2 and 3 as per Verhaar et al, 1992) and acetyl cholinesterase inhibitors. There are a number of possible reasons for these deviations.
Many of the Narcosis II and III substances are ionisable and it is therefore possible that the correlation between water solubility and toxicity has been influenced by the pH conditions under which the measurements were made. No agreement has been reached whether or not there is an underlying difference between baseline and polar narcosis, with Roberts and Costello (2003) proposing there is a difference, due to differences in physical chemistry, and Vaes et al (1998) suggesting there is no difference. These latter authors demonstrated that for a set of polar substances, unionised at physiological pH there was no real difference between polar and non-polar narcosis mechanisms in aquatic toxicity when plotted against log KDMPC (DMPC = 1,2-dimyristoyl-sn-glycero-3-phosphocholine) instead of log KOW and indicated that the approach could be used to account for differences in LC50 between MoAs 1 and 2. Thus in their opinion there was no real difference in mode of action between polar and non-polar narcotics. However, these hypotheses are based purely on relations between aquatic toxicity and KOW or KDMPC, with no reference being made to the role ionisation might play.
Su et al (2012) in their work on toxicity of polar and non-polar narcotics supported the work of Vaes et al (1998) preferring to use the term ‘baseline’ narcotic toxicity rather than ‘non-polar’ narcotic toxicity, because it transparently presents the effect of hydrophobicity on toxicity and the relationship between the hydrophobic parameter log KOW and toxicity. According to the authors, the difference between the toxicity of polar and non-polar narcotics disappears by inclusion of a polarity descriptor (e.g. KDMPC) as well as the hydrophobic parameter log KOW. However, if log KOW is just another way of representing activity, then it follows that the plots of activity versus liquid solubility for polar chemicals should also have slopes similar to those of baseline narcotics but the intercept should be different. This was not found in this study (Figures 2-7) where slopes were inconsistent for all graphs, acute or chronic, for the set of polar substances used so it is not possible to support the proposals of Vaes et al (1998) or Su et al (2012) with this work.
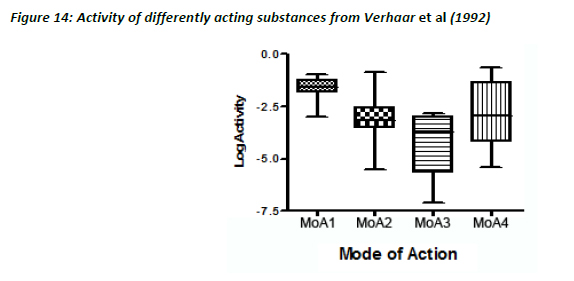
The data from Verhaar et al (1992) was also plotted as described above. Figure 13 below shows the dataset with substances not reaching 80% of equilibrium within the acute exposure period removed, and water-miscible substances adjusted according to their pseudo solubility (Mackay, 2001).
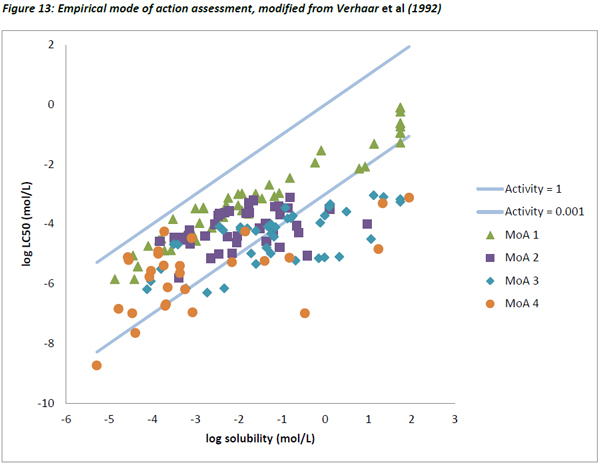
As seen with the Russom dataset, the lowest variability in the activity values was seen for MoA 1 substances, the others showing much greater variability (Figure 14).
Like the Russom data and the dataset from this study, a very good correlation between water solubility and LC50 was observed for Verhaar’s Class 1 substances with a slope of 0.762 and an R2 of 0.91.
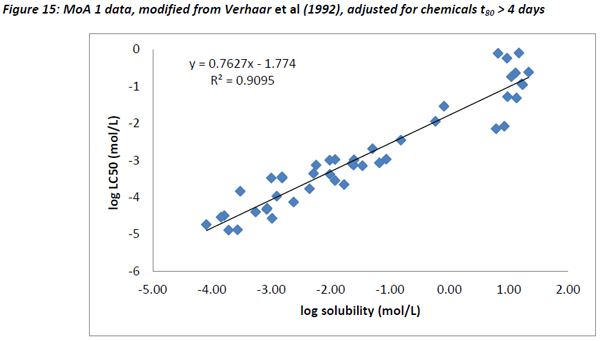
In contrast, there were very poor correlations for MoA 2 (R2 = 0.16, slope = 0.27), MoA 3 (R2 = 0.50, slope = 0.40) and MoA 4 substances (R2 = 0.34, slope = 0.38). This is in agreement with the concept that for specifically acting toxicants, water solubility is a poor descriptor of toxicity.
It is important to mention that 50% of the data considered valid (Klimisch 1 and 2) in ECHA-disseminated dossiers were found in this study to be flawed and therefore were not used. This highlights that limitations around data quality are still quite prevalent. This applies to water solubility and melting point data, as well as ecotoxicity data, since these values are critical for establishing these relationships. Due to inherent variability between and within laboratories, care must be taken in the development of high quality data. However, as high correlations for MoA 1 chemicals were observed for this study, the development of such data is possible. The similarities in the fish acute slope between the Russom et al (1997), Verhaar et al (1992) and this dataset support this. It is recommended to consider the development of high quality toxicity data using purpose-built study methodologies accounting for time to steady state, and measurement of concentrations in the test organism as well as the exposure medium. These may also be designed in accordance with the mode of action. Such work is underway (Mayer and Reichenberg, 2006; Mayer and Holmstrup, 2008; Engraff et al, 2011; Smith et al, 2013; Schmidt et al, 2013).
Polar narcotics pose a new source of methodological challenges and these will need to be considered in the study design and should be separated from non-polar narcotics. The toxicity of MoA 3 and 4 chemicals may be less easy to predict using an activity-based method and it is recommended to concentrate first on MoA 1 and 2 for which high quality QSARs could be produced within a reasonable timeframe. The task force also propose further work in order to obtain better MoA predictions.